
-
Syllabus

Mastering Data Analysis: A Complete Handbook for Data Analyst Courses in Mumbai!
Introduction to Data Analysis
The primary function of a data analyst to assist corporate decision-making is to collect, assess, and interpret data. Companies need data analysis in order to identify trends, patterns, and insights that might promote growth, boost productivity, and enhance customer experience.
Complete instruction is provided in statistical analysis, data mining, machine learning, and data visualisation tools like as Tableau and Power BI in data analyst courses in Mumbai. After finishing these courses, students will be equipped to excel in data analysis, a field in which many industries—including banking, healthcare, marketing, and e-commerce—highly value expertise. By taking these Data analyst classes in Mumbai, individuals may progress their businesses and increase their prospects of success in the workforce.
Fundamentals of Data Analysis
One of the foundations of data analysis is knowledge of data types and structures; information must be arranged and analysed correctly. Data cleaning and preprocessing techniques are necessary to manage missing values and transform data for analysis, ensuring data accuracy and reliability. Analysing data visualisation tools like Tableau and Python libraries enables analysts to make judgements and visually present their results. Gaining an understanding of these fundamental ideas enables individuals to overcome obstacles in data analysis, from the initial data collecting to the perceptive visualisation, therefore enhancing their ability to make important conclusions from the data.
Data Analyst's Guide to Statistical Analysis
Data analysts use descriptive statistics, a subset of statistical analysis, to summarise data using measures like mean, median, and mode in order to understand important patterns. When deriving conclusions and predictions about populations from sample data, statistical significance is ensured via inferential statistics and hypothesis testing.
Regression analysis and predictive modelling identify correlations between variables and predicted outcomes to assist with trend prediction and decision-making. Data analysts may use data-driven strategies to gain significant insights, form informed opinions, and advance business performance by knowing these statistical techniques.
Machine Learning and Data Mining
Data mining is the study of meaningful patterns from large datasets with the goal of knowledge discovery and decision-making. Prediction models are trained with labelled data by supervised machine learning; patterns without predetermined labels are found by unsupervised learning. Analysts may develop and use prediction algorithms for a variety of applications by putting machine learning models into Python/R.
With so many techniques at their disposal—from linear regression to neural networks—analysts can accurately foresee and make inferences from data. When one masters these techniques, one may apply data in a number of sectors, such as banking, healthcare, and marketing.
Analytics of Big Data
Big data analytics processes and examines large, complex datasets for significant insights. The Hadoop ecosystem, which comprises MapReduce and HDFS, makes large data distribution and processing feasible. Real-time data processing and machine learning both heavily rely on Apache Spark, a quick and flexible huge data processing engine.
Analytics of big data finds numerous real-world applications, such as:
- Predictive maintenance reduces downtime in the industry
- Customised product recommendations in retail enhance client experience
- Medical early disease detection via patient data analysis
- Recognition of patterns for financial fraud detection
Big data analytics gives businesses a competitive edge in their own industries, enables them to make data-driven decisions, and enhances operations.
Data Visualisation and Reporting
Tableau and Power BI are examples of data visualisation tools that enable interactive dashboards with real-time insights and data exploration. These dashboards combine important data sets and analytics so users may track outcomes, see trends, and make informed decisions.
Effective communication of results is essential to data reporting. Analysts can simply explain complex data with the right visualisations—maps, graphs, and charts. Among the finest methods to highlight important information in data reporting to the audience are clear labels, captions, and colour schemes.
After data visualisation, best practices—consistency, clutter reduction, and accessibility—help create engaging and instructive reports that facilitate data-driven decision-making.
Practical Project and Case Study in the Online Data Analyst Training Institute in Mumbai
Practical projects and case studies in data analysis require applying techniques directly to real datasets from a range of companies. By obtaining a perceptive understanding of problems and trends particular to their industry, professionals who examine these datasets enhance their analytical skills. Giving conclusions and recommendations based on data analysis demonstrates that one is not only an expert in data interpretation but also able to get a practical understanding of decision-making. Through these programmes, participants have a solid understanding of data analysis methods, which enhances their ability to solve problems and prepares them to deal with complex commercial scenarios.
Placement of Jobs and Advancement of Careers in the Online Data Analyst Training Institute in Mumbai
A seamless transition into the data analysis sector depends on help with job placement and career advancement. Being prepared for an interview and putting together a résumé allow one to showcase their experience and analytical skills. Possibilities to network with industry experts provide invaluable contacts and up-to-date information on best practices and new advancements. A fulfilling and successful career in data analysis is also guaranteed by career coaching, job placement services, and job matching services.
Capstone Project
As the last assignment a data analyst does, the capstone project combines all of their acquired skills and knowledge into one large-scale final endeavour. In most cases, this project involves using many data analysis techniques on a real-world dataset and reporting the findings in a comprehensive data analysis report. Peer and instructor feedback and evaluation provide perceptive analysis and constructive criticism, developing students' presenting and analytical skills. Demonstrating their capacity to manage challenging problems and successfully communicate findings, the capstone project prepares students for success in the data analysis business.
Conclusion
Finally, graduates of the data analyst courses in Mumbai have gained basic data analysis abilities encompassing significant subjects such as machine learning, big data analytics, statistical analysis, and data types. Given the continually evolving data trends and technologies, data analysis calls for ongoing learning.
Embracing lifelong learning assures professionals that they stay competitive and up to date with industry changes. Data analytics has promising futures as industries like e-commerce, healthcare, and finance will need more skilled data analysts. Those who stay current and advance their skills may seize the various opportunities in the always-developing field of data analytics.
FAQ - Frequently Asked Questions
Reviews
💬 Talk to Adviser
Get expert guidance from our experienced professionals in every field.
Skills & Tools You'll Learn
Programming Fundamentals
- Algorithms & Data Structures
- Problem Solving
- OOP Concepts
- Version Control (Git)
Development Tools
- IDEs & Text Editors
- CLI & Terminal
- Package Managers
- Build Tools
Software Practices
- Agile & Scrum
- Testing (Unit & Integration)
- Code Reviews
- CI/CD Workflows
Platforms & Technologies
- Databases (SQL/NoSQL)
- Cloud (AWS, GCP)
- APIs (REST & GraphQL)
- Docker & Kubernetes
Our Certifications
Gain globally recognized certifications that validate your skills and boost your career.
Earn Your Achievement Certificate
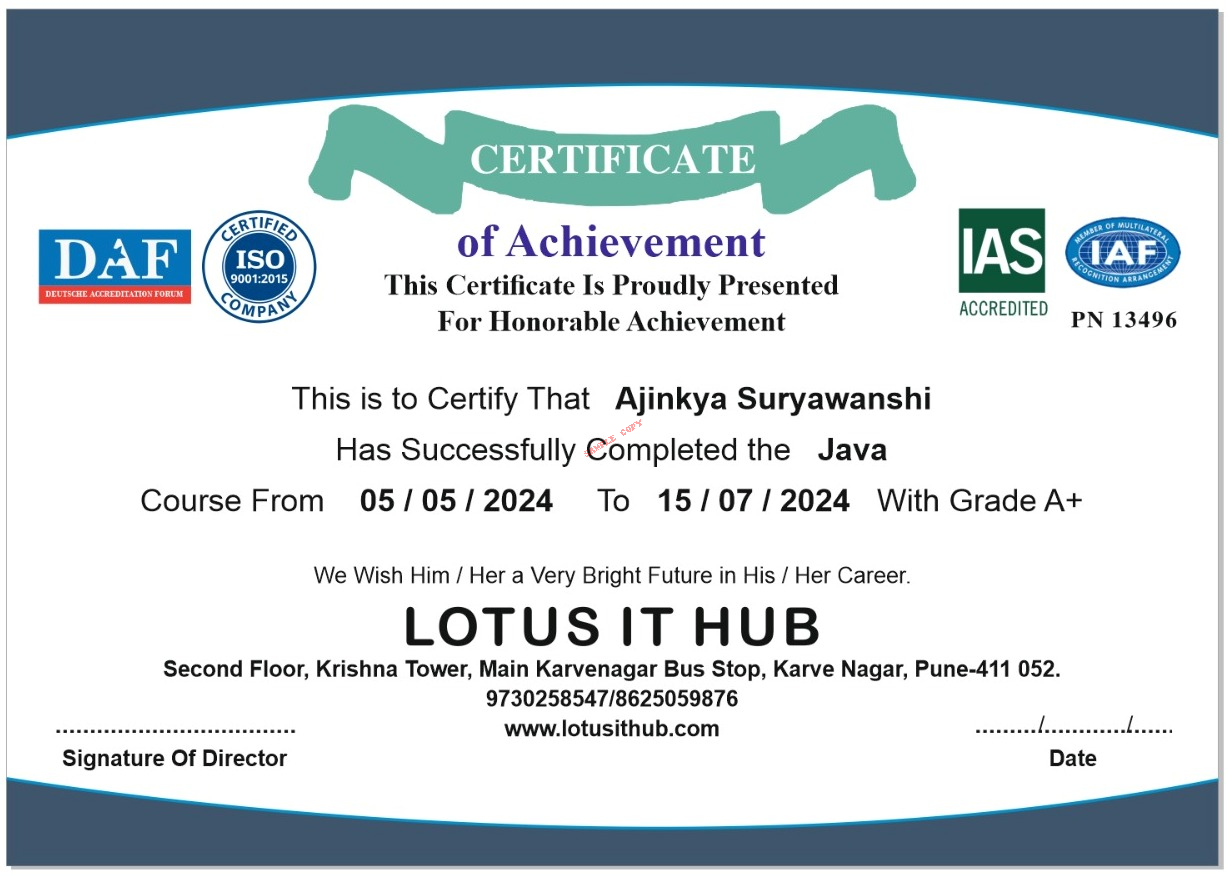
After completing your course, you’ll receive a verified certificate from Lotus IT Hub, showcasing your mastery of industry-relevant skills. This certificate can be shared on LinkedIn, added to your resume, and helps you stand out in the job market.
- Globally recognized certificate
- Verification ID for authenticity
- Downloadable digital format
- Shareable on LinkedIn & portfolios
Why Choose Lotus IT Hub
Empowering your career through expert training
Affordable & Customized Programs
Flexible pricing and learning plans
Hands-On Project Learning
Real-world practice to boost your skills
One-on-One Mentorship
Personalized guidance from industry experts